Improving Real-Time Decision Making in Qatium’s Water Network Platform
Qatium is a digital twin platform designed to help water utilities and operators manage and simulate water distribution networks in real time. The system ingests and processes large amounts of hydraulic, geospatial, and operational data to offer actionable insights.
The product is used by technical and non-technical profiles across the globe, often under stressful or high-risk scenarios such as water leaks or system failures.
Product Designer, SaaS, Complex Systems, Real-time Monitoring
Period: 2020-2021
The Design Challenge
How might we enable users to monitor, understand, and act on real-time water network data—without overwhelming them with technical complexity?
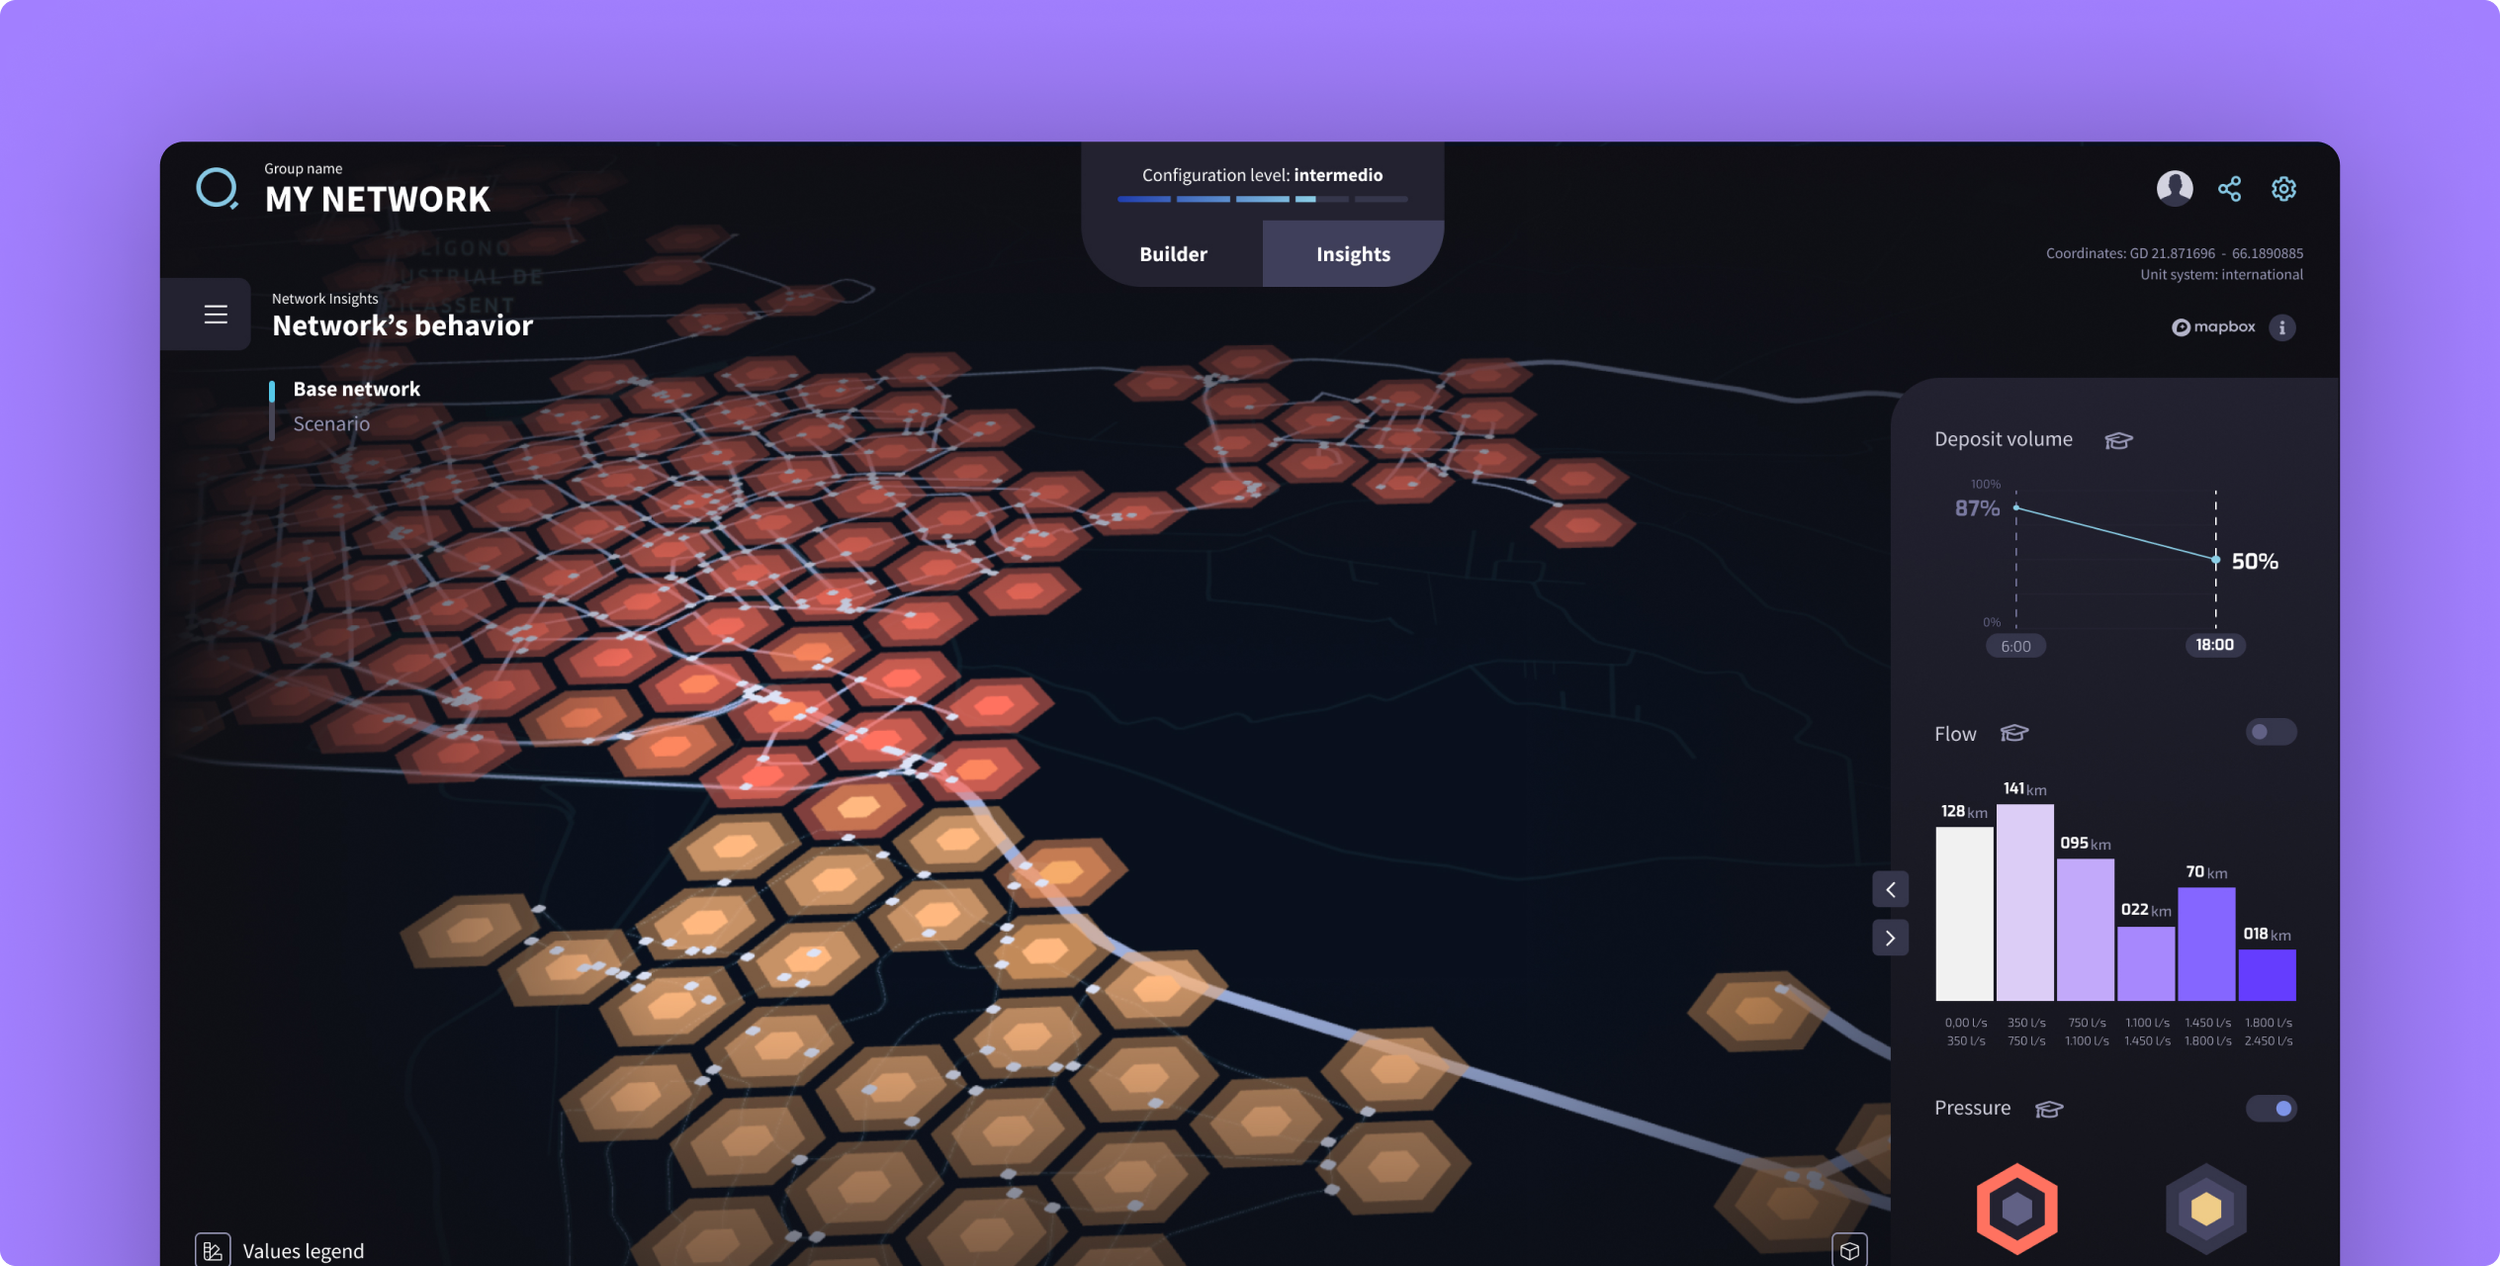
Qatium's power lies in its data—but visualizing such vast, multi-layered information (nodes, pressure, flow, consumption, alerts, and simulations) requires a careful balance of clarity, prioritization, and intuitive UX.
My Role & Impact
As a Product Designer embedded in a cross-functional team, I led the design of core platform interfaces, including:
Real-time network monitoring dashboard
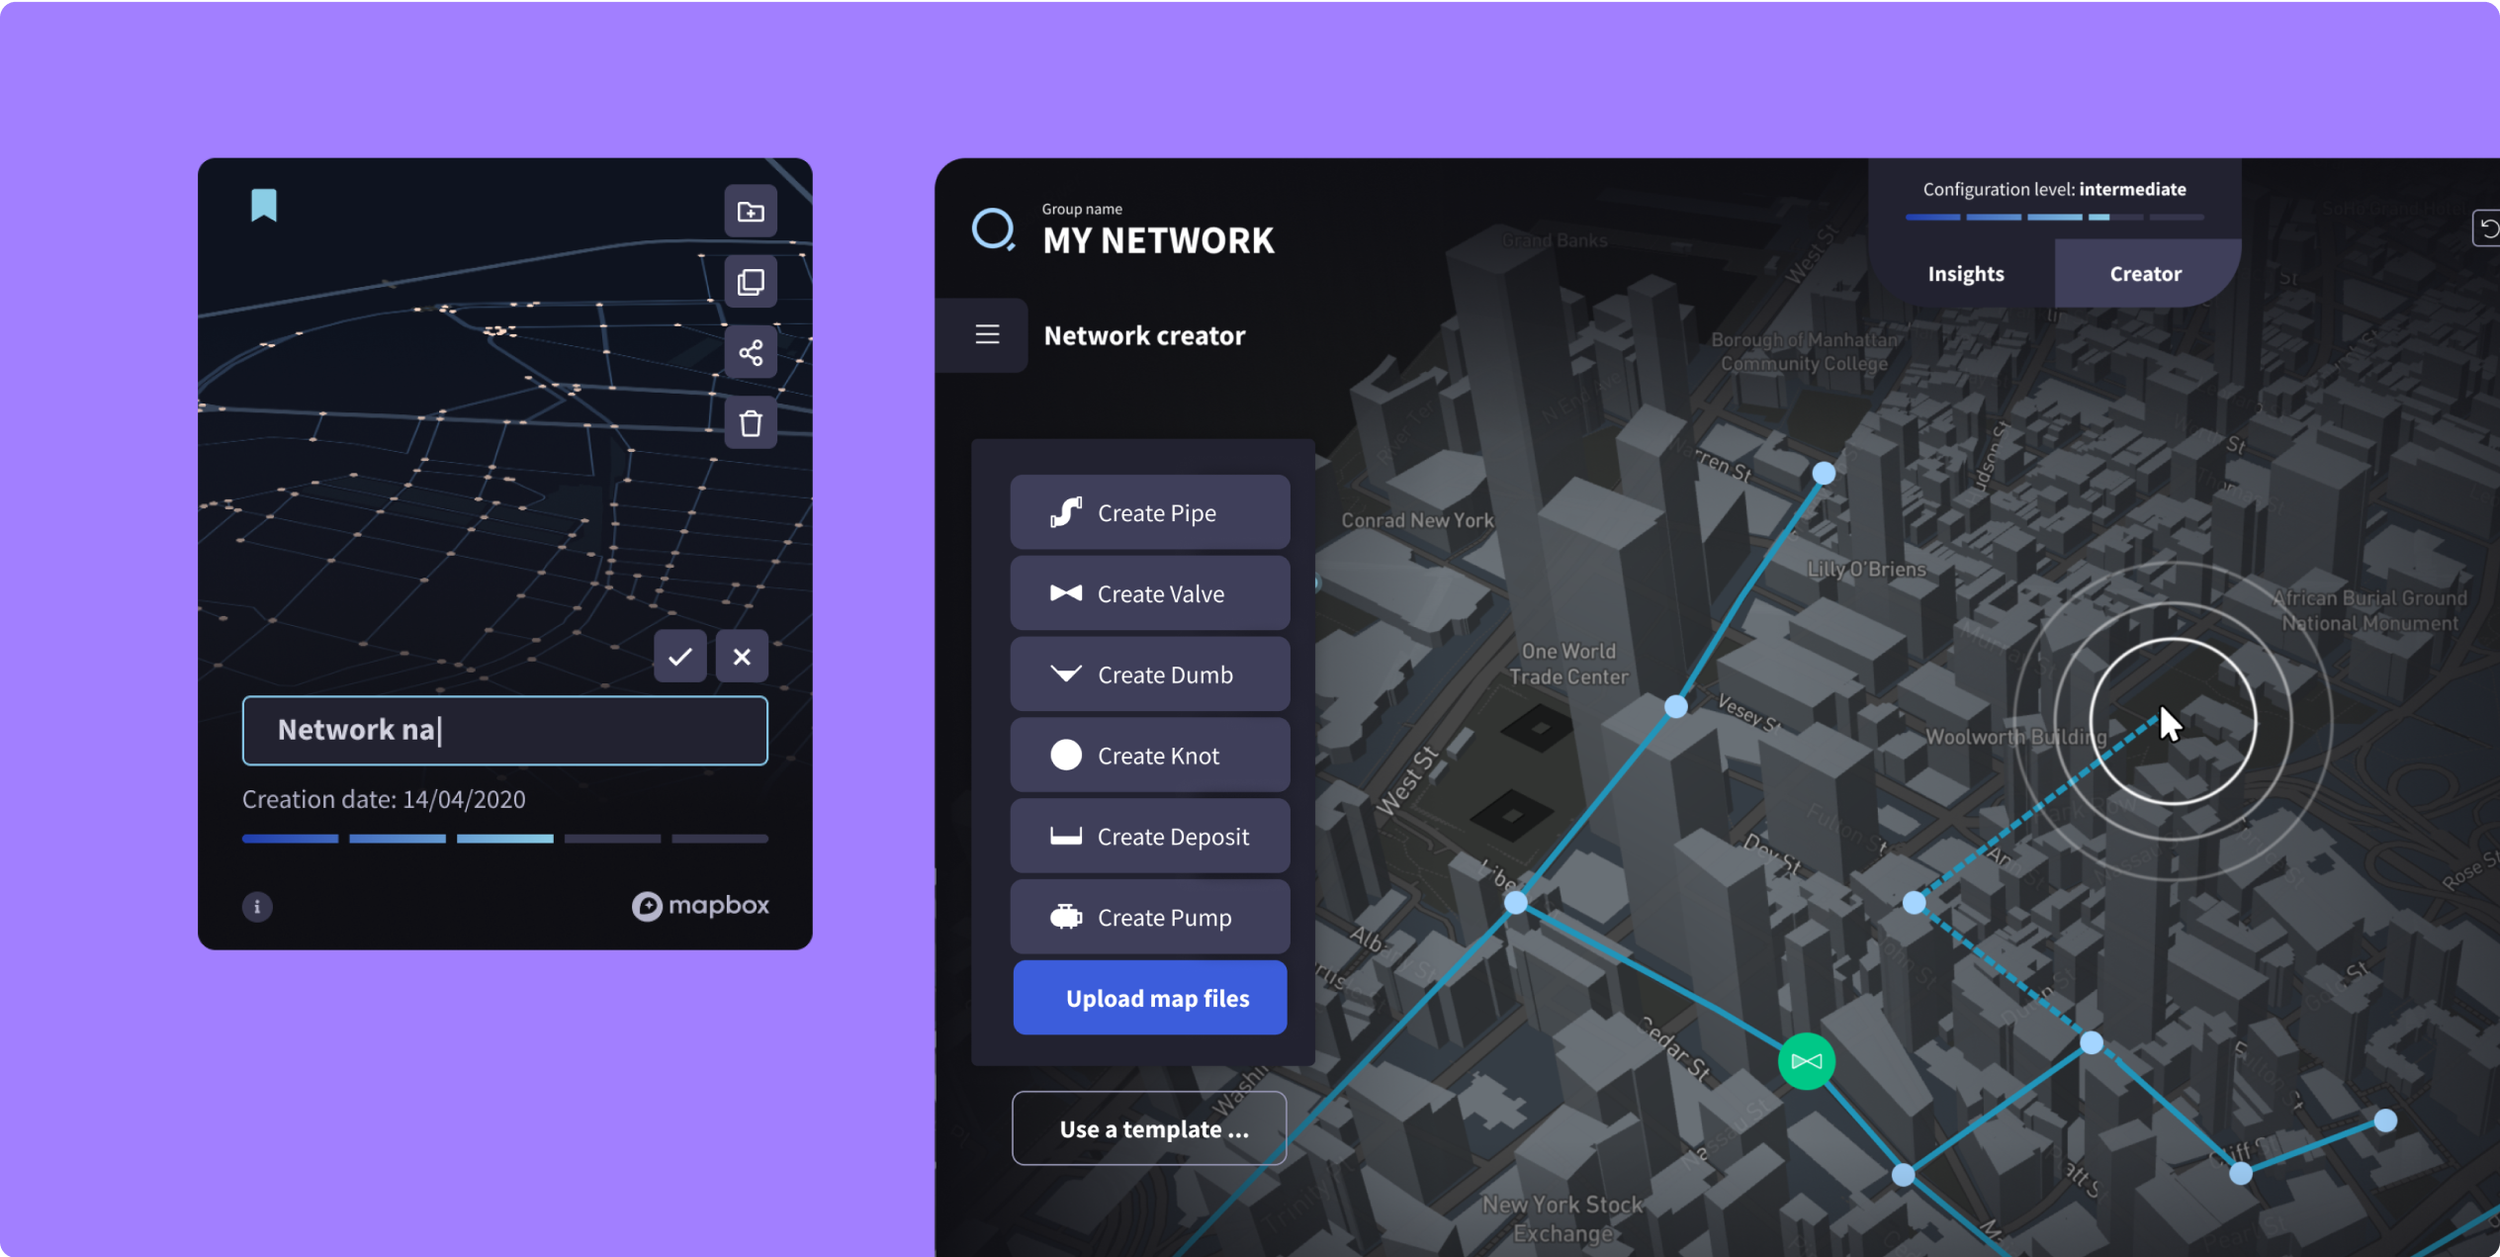
Multi-scenario simulation interface
Alerts and anomaly detection system
Side panel with contextual data and editing tools
I worked closely with engineers, hydraulic modelers, and PMs to transform complex data logic into actionable and accessible UI patterns.
My main goal was to simplify complexity—making dense technical data understandable for all operator profiles, while ensuring the interface could scale with future features.”

Design Process
1. Discovery
Interviewed operators from Spain, France, and the U.S. to understand workflows, stress points, and mental models.
Audited internal data flows and observed how operators interacted with existing GIS-based systems.
2. Definition
Identified key user jobs: locate events, simulate future actions, compare scenarios, respond to alerts.
Prioritized responsiveness and clarity for mobile and desktop usage, as teams often operate in the field.
3. Design & Prototyping
Designed interaction models for:
Live data overlays on the map
Scenario simulation switcher and comparison view
Visual prioritization of critical alerts (e.g. leaks, pressure drops)
Created UI components to display geospatial and time-based data intuitively.
Validated with users through usability testing and design critiques.
4. Delivery
Delivered final UI specs and interactive prototypes using Figma.
Supported the frontend team with implementation QA and component documentation.


Results & Impact
Although Qatium is a fast-evolving product, and some features were rolled out gradually, early signals showed strong user engagement and performance gains:
✅ -35% faster alert response time among operators using the new monitoring view
✅ +60% increase in task success rate in scenario simulations
✅ Reduction of cognitive load reported in user testing sessions (via SUS score and qualitative feedback)
✅ Better data literacy among non-technical users—thanks to clearer labeling and visual hierarchy
✅ Reusability of components, enabling faster development for future modules
Learnings
Designing for data-rich environments requires ruthless prioritization: not every metric or layer is useful in every moment.
Working with domain experts is critical: involving hydraulic engineers early helped me translate raw data into meaningful patterns.
Scaling a design system in parallel to building UI allowed for quicker iterations as the platform matured.
Highlights
Product Design for complex geospatial and simulation data
Impact on response time and usability in real-time scenarios
Hands-on collaboration with engineers and data experts
Scalable design system for a mission-critical platform
Qube Design System
As part of the design team who established and applied a Design System for design and development, we push to oversee documentation, design tokens, components, assets, layouts, and typography. The system was named Qube.


